Berkeley Earth Global Temperature Data
Berkeley Earth publishes an unique dataset with global temperature measurements. Below is a guide to the download the data and start analyzing it using Python. All code can be found in this gist.
Download .txt file from Berkeley Earth data website section "Land + Ocean (1850 — Recent)" and read it using the following Python command:
colspecs = [(2, 6), (10, 12), (14, 22), (24, 29)]
df = pd.read_fwf(
"/content/drive/My Drive/Colab Notebooks/berkeley_earth/data/Land_and_Ocean_complete.txt",
colspecs=colspecs,
header=85
)
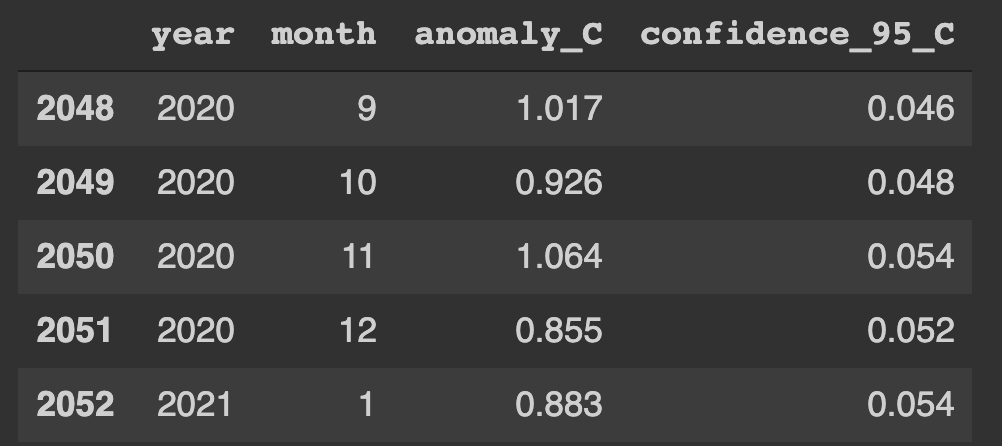
df.columns = ["year", "month", "anomaly_C", "confidence_95_C"]
df.head(12)
colspecs defines the column indexes so (2, 6) represents year in the source text file.
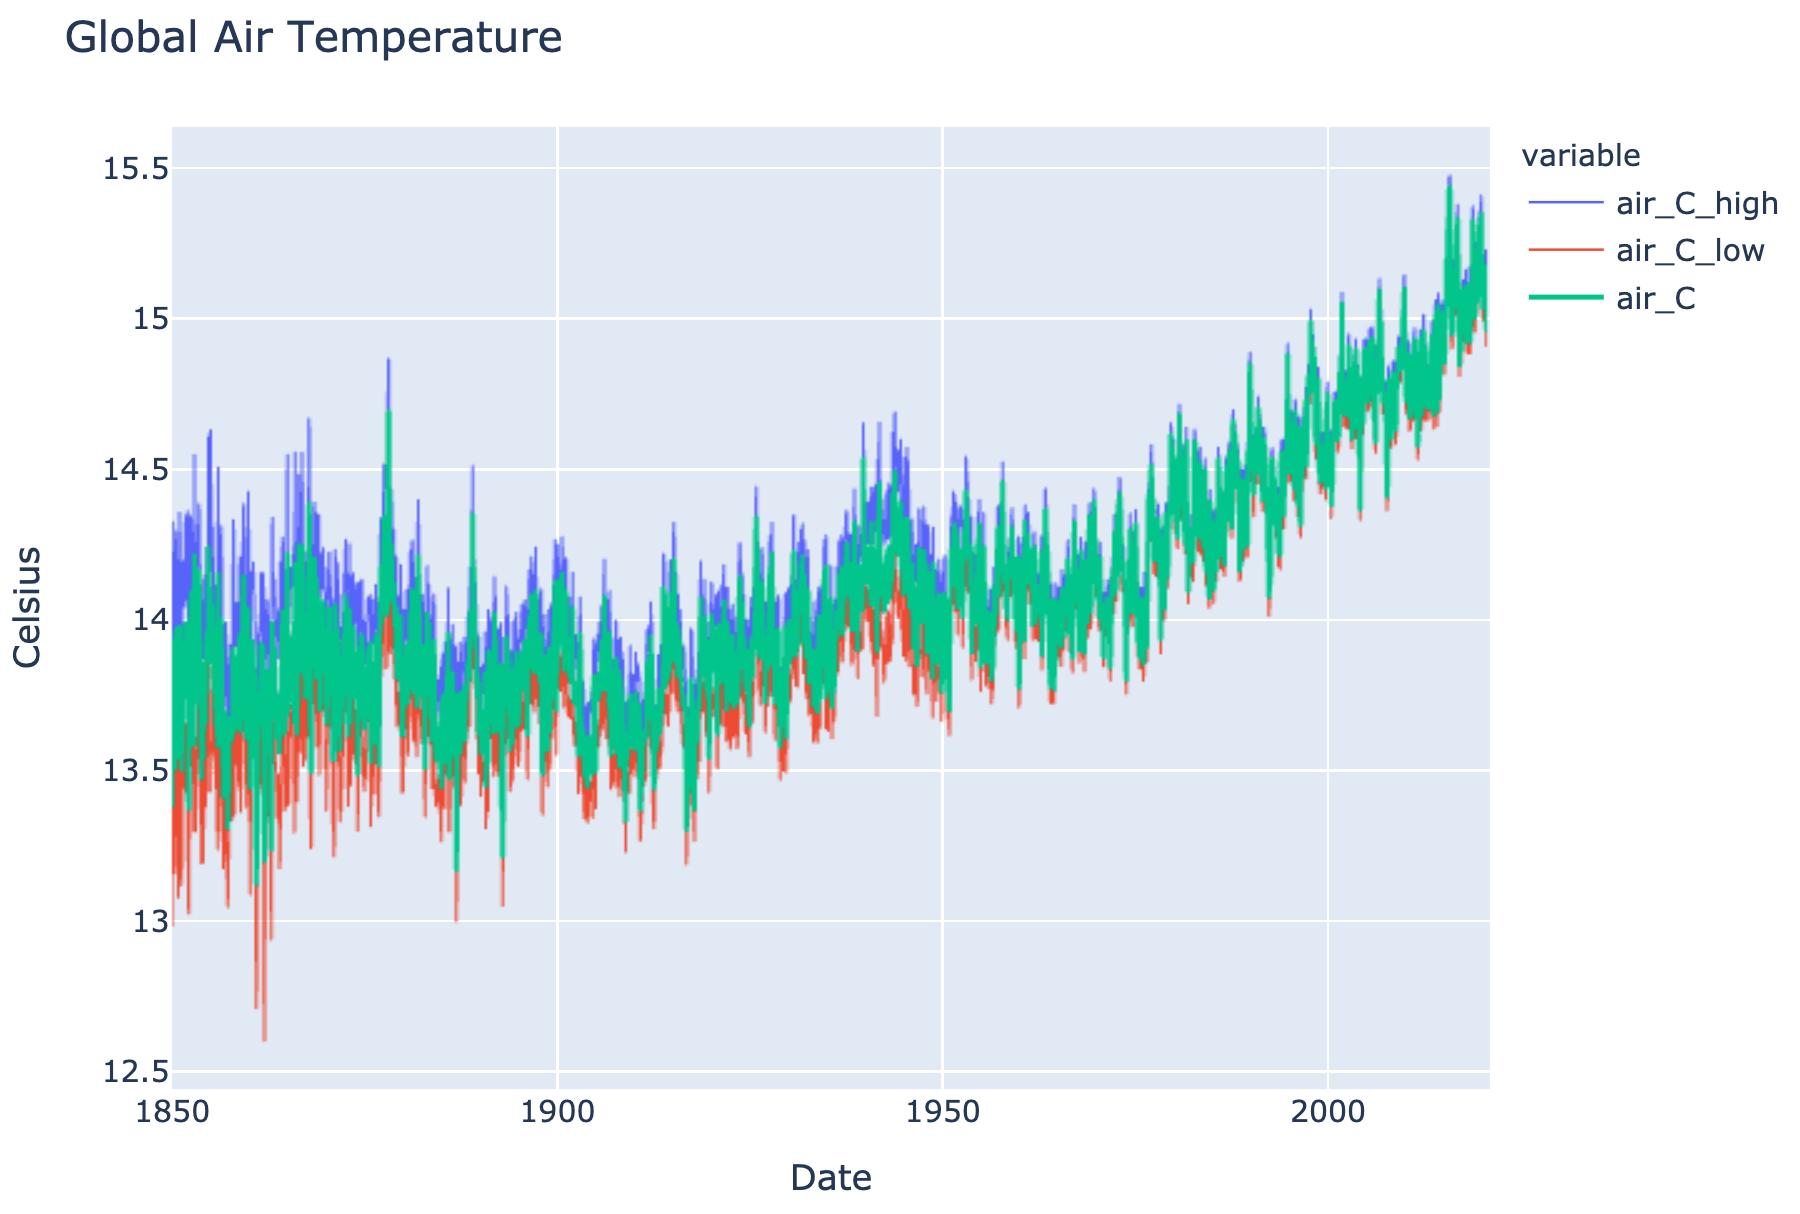
The data documentation explains that anomaly_C is the recorded temperature anomaly in Celsius relative to estimated Jan 1951-Dec 1980 global mean temperature of 14.108 +/- 0.02. The chart below shows the absolute air temperatures along with 95% uncertainty intervals (in green) recorded during the 2000s.