Company Analysis
The report below provides an illustrative example of a company analysis. All figures and financial data are hypothetical and are presented solely for demonstration purposes.

Overview
Business Overview. Apple designs, manufactures and markets smartphones, personal computers, tablets, wearables and accessories, and monetizes its installed base through a growing portfolio of services.
Ownership Structure. Apple has a single publicly traded common-equity class rather than a dual-class founder-control structure; its balance sheet reports common stock only. Each common share carries one vote.
| Rank | Owner Name | Owner Type | Shares Held (million) | % of Class Owned |
|---|---|---|---|---|
| 1 | The Vanguard Group | Institution | 1,430.00 | 9.72% |
| 2 | BlackRock | Institution | 1,150.00 | 7.86% |
| 3 | State Street Corporation | Institution | 604.06 | 4.11% |
| 4 | Geode Capital Management | Institution | 358.03 | 2.44% |
| 5 | Fidelity Investments | Institution | 307.40 | 2.09% |
Top Most Significant Apple Stories of 2026.
-
Apple leadership transition: Tim Cook steps down as CEO and moves to executive-chair duties — September 2026.
-
Tariff refunds provide a material Q3 earnings benefit. Apple disclosed that favorable tariff refunds added roughly two percentage points to quarterly gross margin.
-
Google Gemini positioned to power a more personalized Siri experience — February 2026. Reporting around Alphabet's results said a customized version of Gemini was set to support a more personalized Siri experience.
Competitive Landscape — Financial Comparison. The peer group is analyst-selected for direct strategic overlap with Apple across devices, PCs, operating-system/platform ecosystems, cloud/digital services, advertising/content, AI and consumer technology.
| Metric | Apple | Amazon | Alphabet | Microsoft | Meta Platforms | Dell Technologies |
|---|---|---|---|---|---|---|
| Ticker | AAPL | AMZN | GOOGL | MSFT | META | DELL |
| Country | United States | United States | United States | United States | United States | United States |
| Most recent completed FY | FY2025 | FY2025 | FY2025 | FY2026 | FY2025 | FY2026 |
| Revenue | 416,161 | 716,924 | 402,840 | 331,839 | 200,966 | 113,500 |
Valuation - DCF
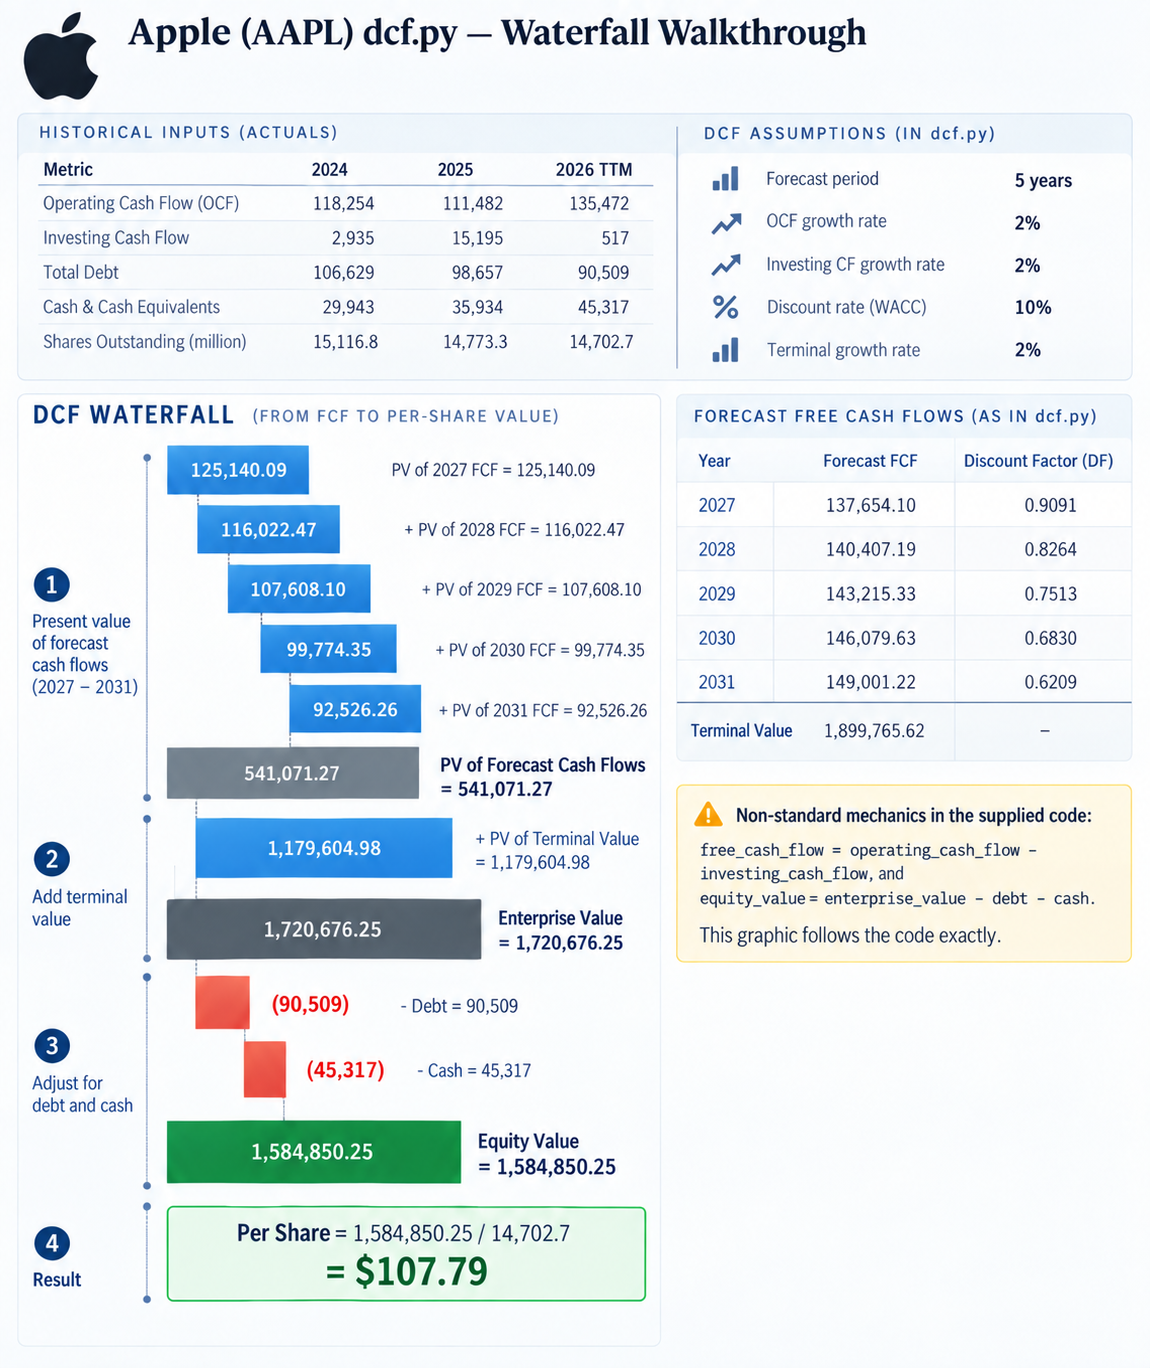
The latest financial report available by the valuation date was the Q1 FY2026 Form 10-Q for the quarter ended December 27, 2025.
- Revenue TTM = FY2025 $416,161 − Q1 FY2025 $124,300 + Q1 FY2026 $143,756 = $435,617.
- Net income TTM = $112,010 − $36,330 + $42,097 = $117,777.
- Operating cash flow TTM = $111,482 − $29,935 + $53,925 = $135,472.
- Investing cash flow TTM = $15,195 − $9,792 − $4,886 = $517.
Input to dcf.py
years                         = [2024, 2025, 2026]
operating_cash_flow           = [118254, 111482, 135472]
investing_cash_flow           = [2935, 15195, 517]
debt                          = [106629, 98657, 90509]
cash                          = [29943, 35934, 45317]
total_shares_outstanding      = [15116.786, 14773.260, 14702.703]

Key dcf.py output
TTM/base free_cash_flow       = 134,955.00
PV forecast free-cash-flow sum= 541,071.27
Terminal value                = 1,899,765.62
Year-5 discount factor        = 0.6209213231
PV terminal value             = 1,179,605
DCF enterprise value          = 1,720,676
Debt deducted                 = 90,509
Cash                          = 45,317
DCF equity value              = 1,675,484
Shares                        = 14,702.703 million
Returned equity value/share   = $114
EV based on market cap:
| Company | Market Cap | + Debt | + Preferred Stock | − Cash | = Enterprise Value |
|---|---|---|---|---|---|
| Apple | 4,089,116 | 90,509 | 0 | (45,317) | 4,134,308 |