KNN: Simple, flexible, naturally handles multiple classes. Slow at scale, sensitive to feature scaling and irrelevant features. scikit tutorial
Linear Discriminant Analysis (LDA): A classifier with a linear decision boundary, generated by fitting class conditional densities to the data and using Bayes’ rule. The model fits a Gaussian density to each class, assuming that all classes share the same covariance matrix. scikit tutorial
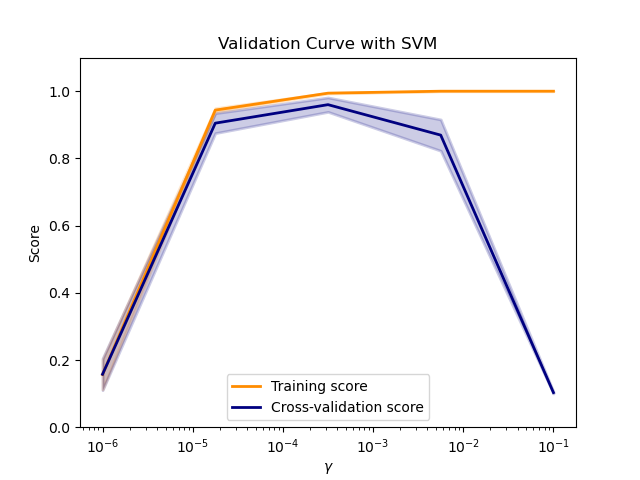
SVM: Effective in high dimensional spaces (or when number of dimensions > number of examples). SVMs do not directly provide probability estimates. scikit
Partial dependence plots (PDP): x-axis = value of a single feature, y-axis = label. scikit
Individual conditional expectation (ICE): x-axis = value of a single feature, y-axis = label. scikit
Permutation feature importance: Randomly shuffle features and calculate impact on model metrics such as F1. scikit
Global surrogate: train an easily interpretable model (such as linear regression) on the predictions made by a black box model
Local Surrogate: LIME (for Local Interpretable Model-agnostic Explanations). Train individual models to approximate an individual prediction by removing features to learn their impact on the prediction
Shapley Value (SHAP): The contribution of each feature is measured by adding and removing it from all other feature subsets. The Shapley Value for one feature is the weighted sum of all its contributions
SOCS of each feature: Shape (skew), Outliers, Center, Spread
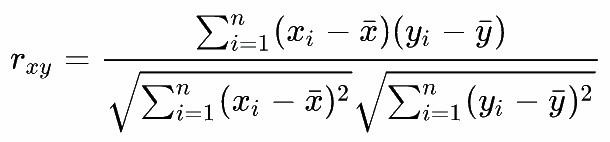
Feature correlation
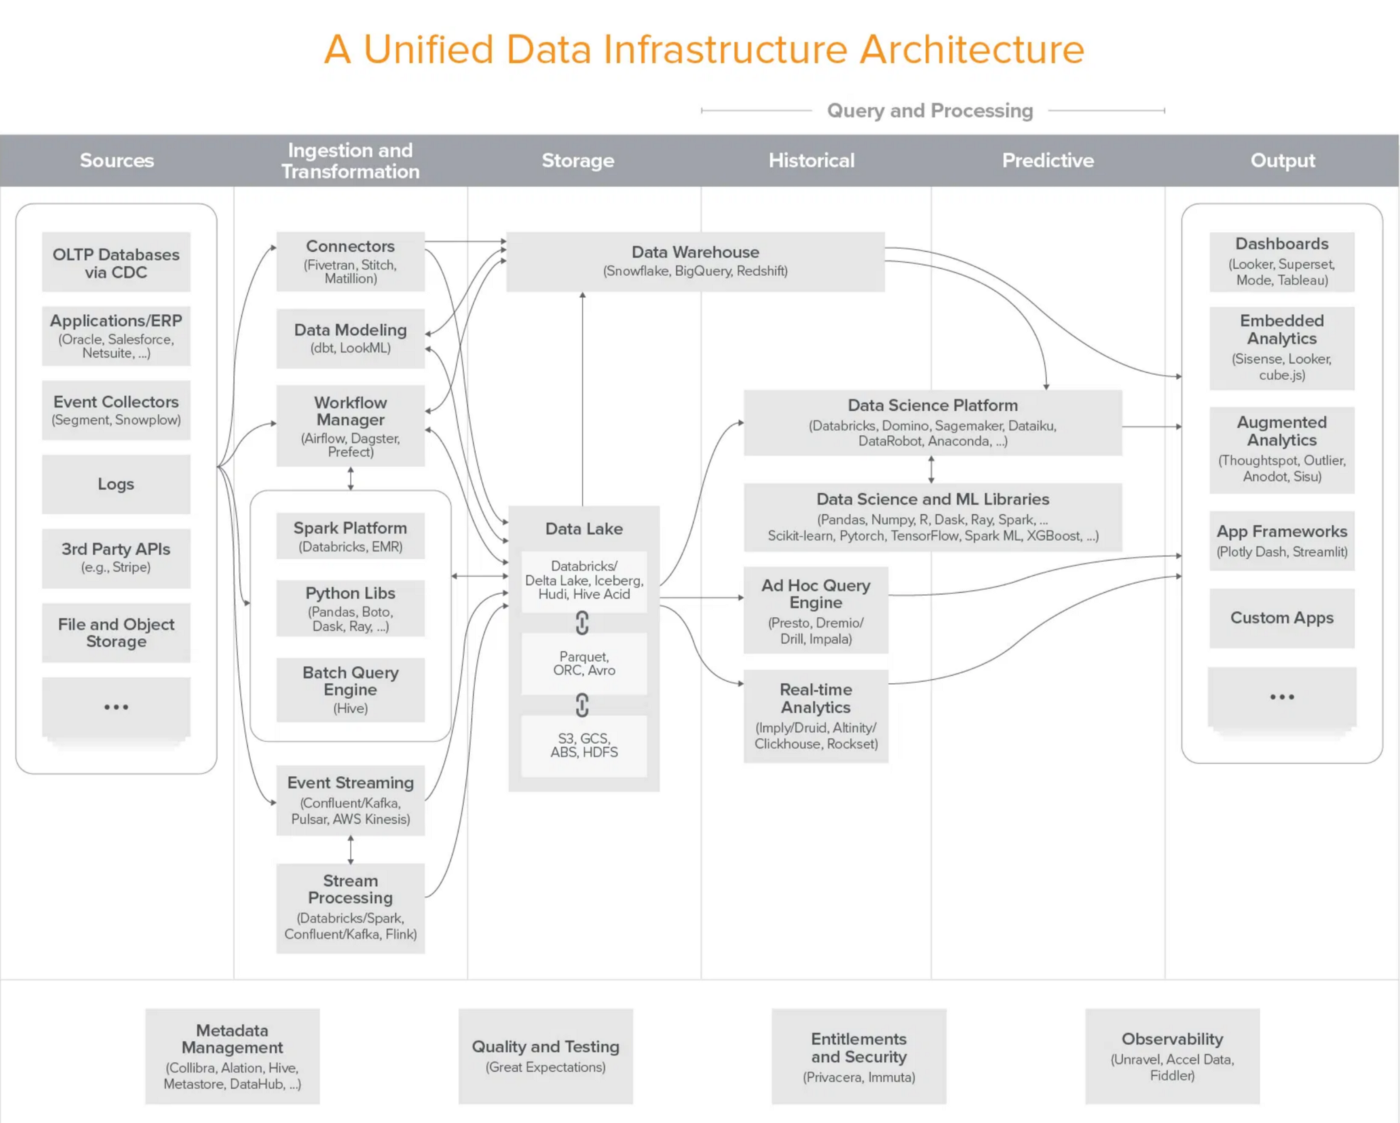
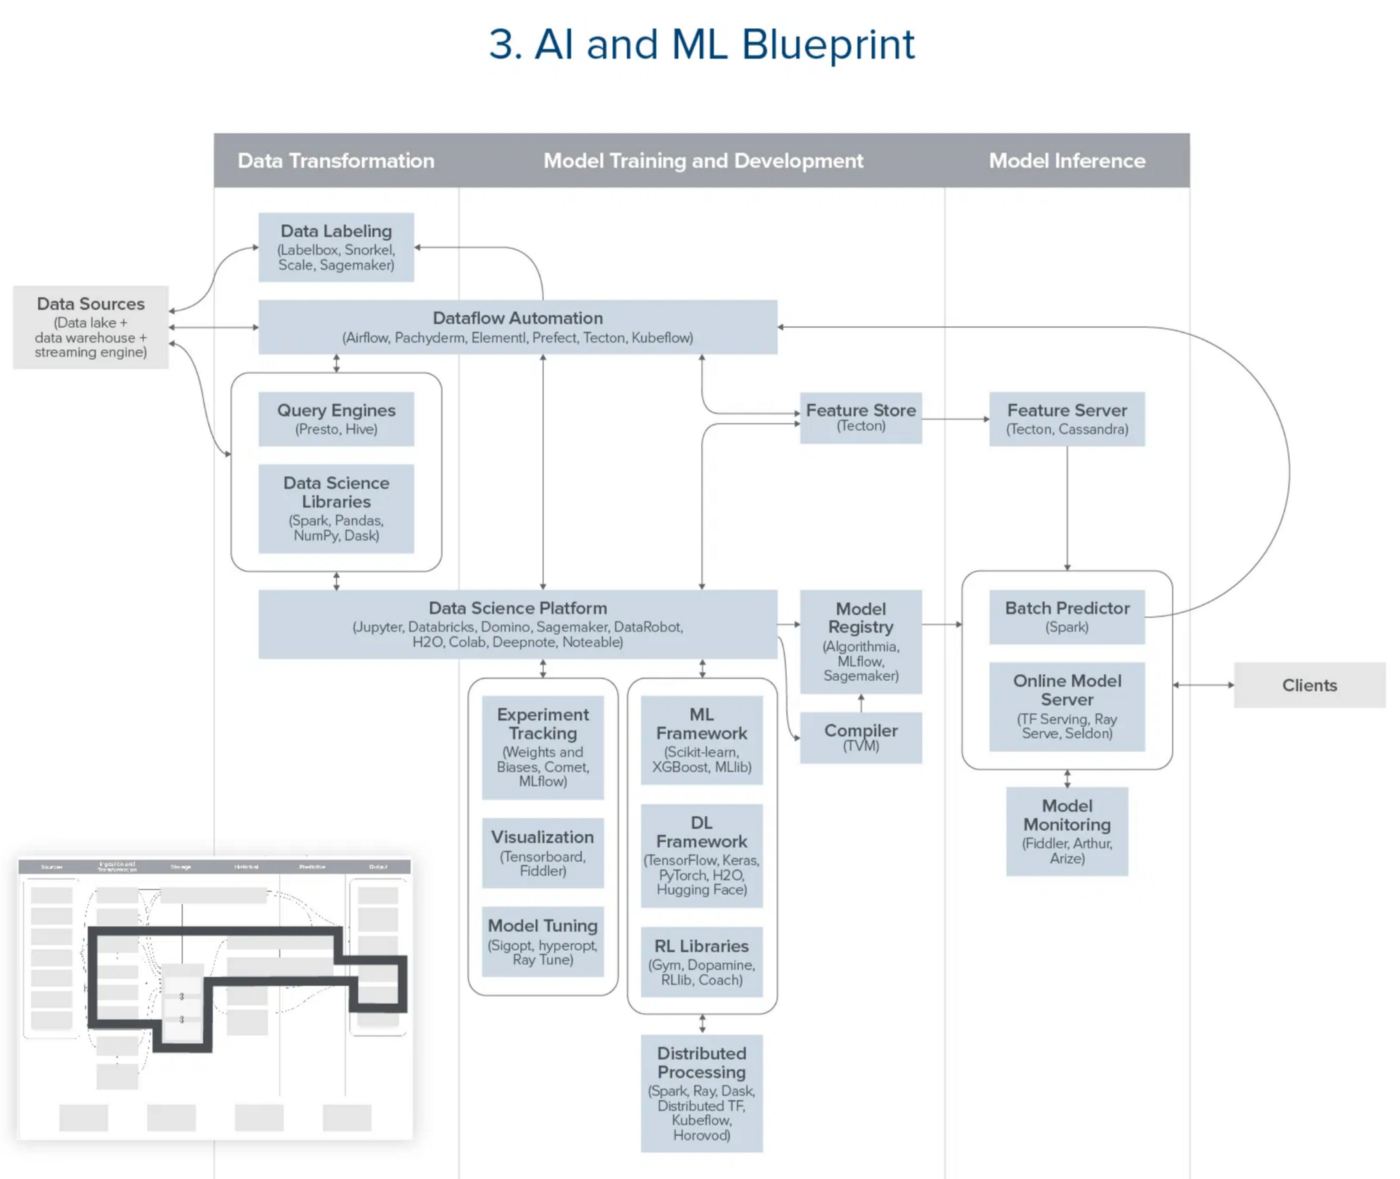
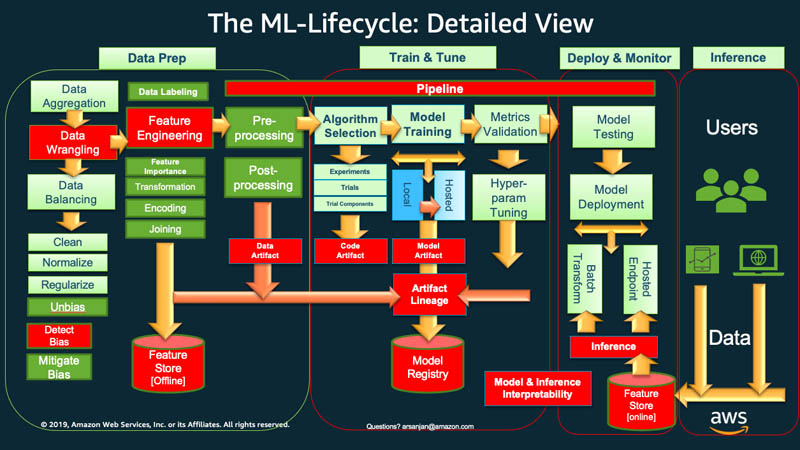
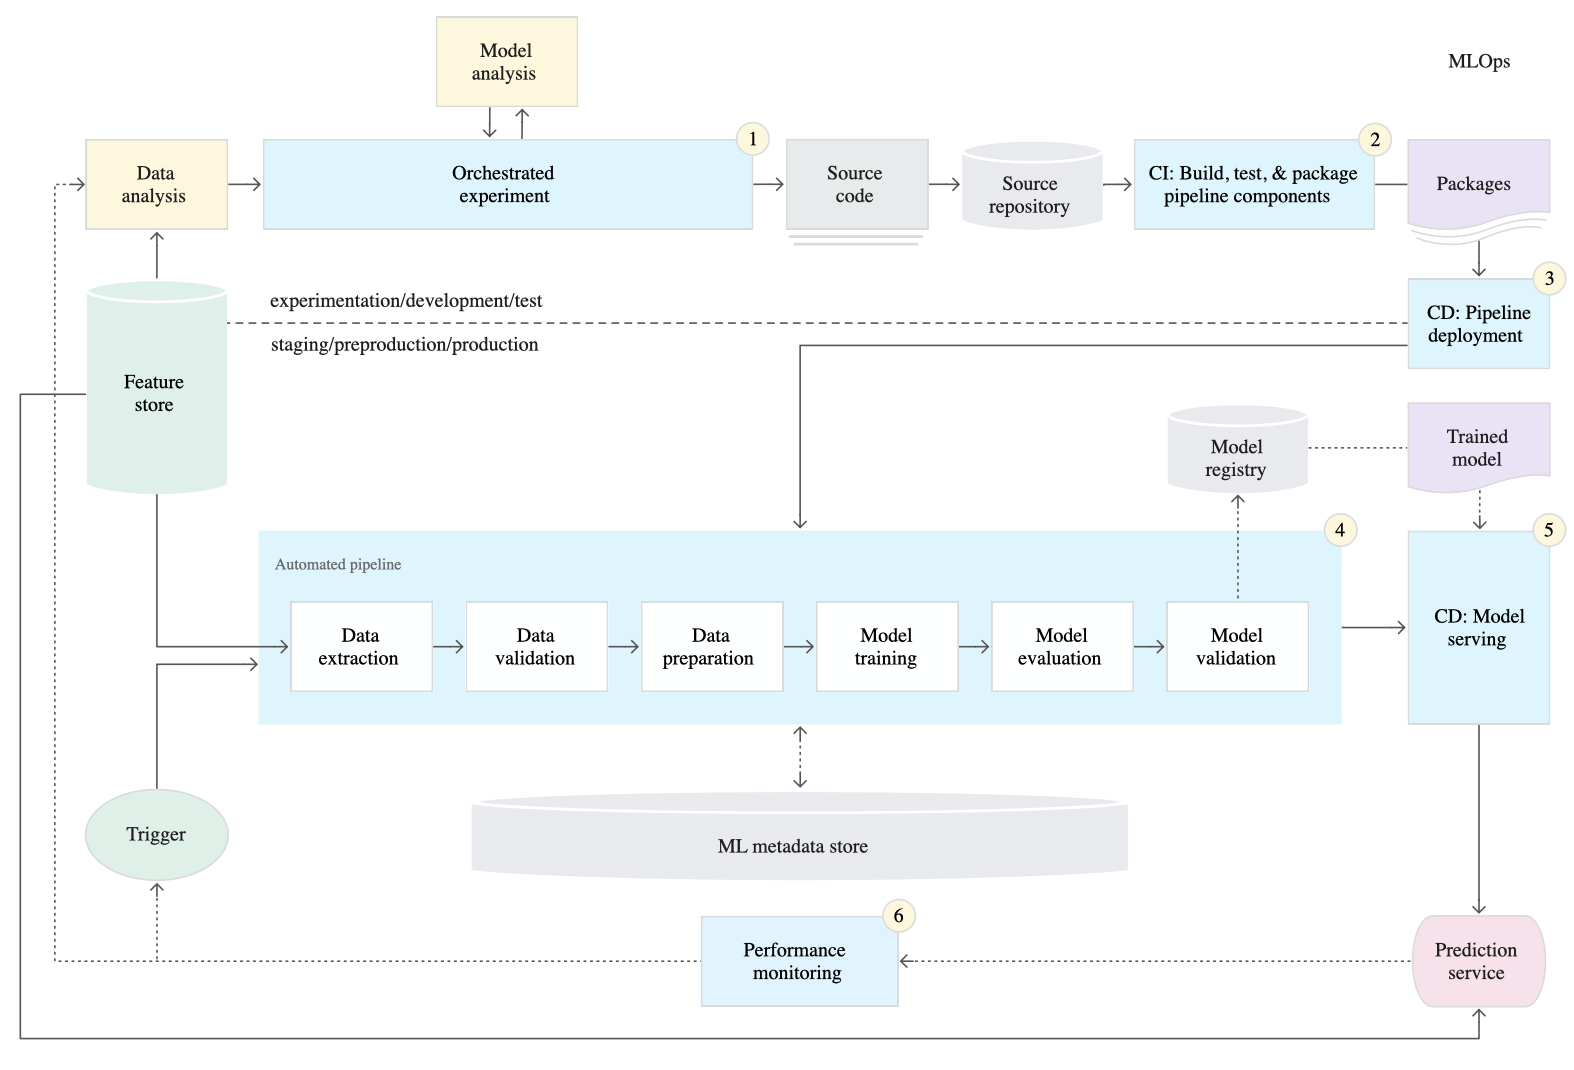
Production pipeline
Outliers: remove or apply non-linear transformations
Missing values
SMOTE: Generate and place a new point on the vector between a minority class point and one of its nearest neighbors, located [0, 1] percent of the way from the original point. Algorithm is parameterized with k_neighbors. tutorial
Standardization
Discretization
Encoding categorical features
Generating polynomial features
Dimensionality reduction
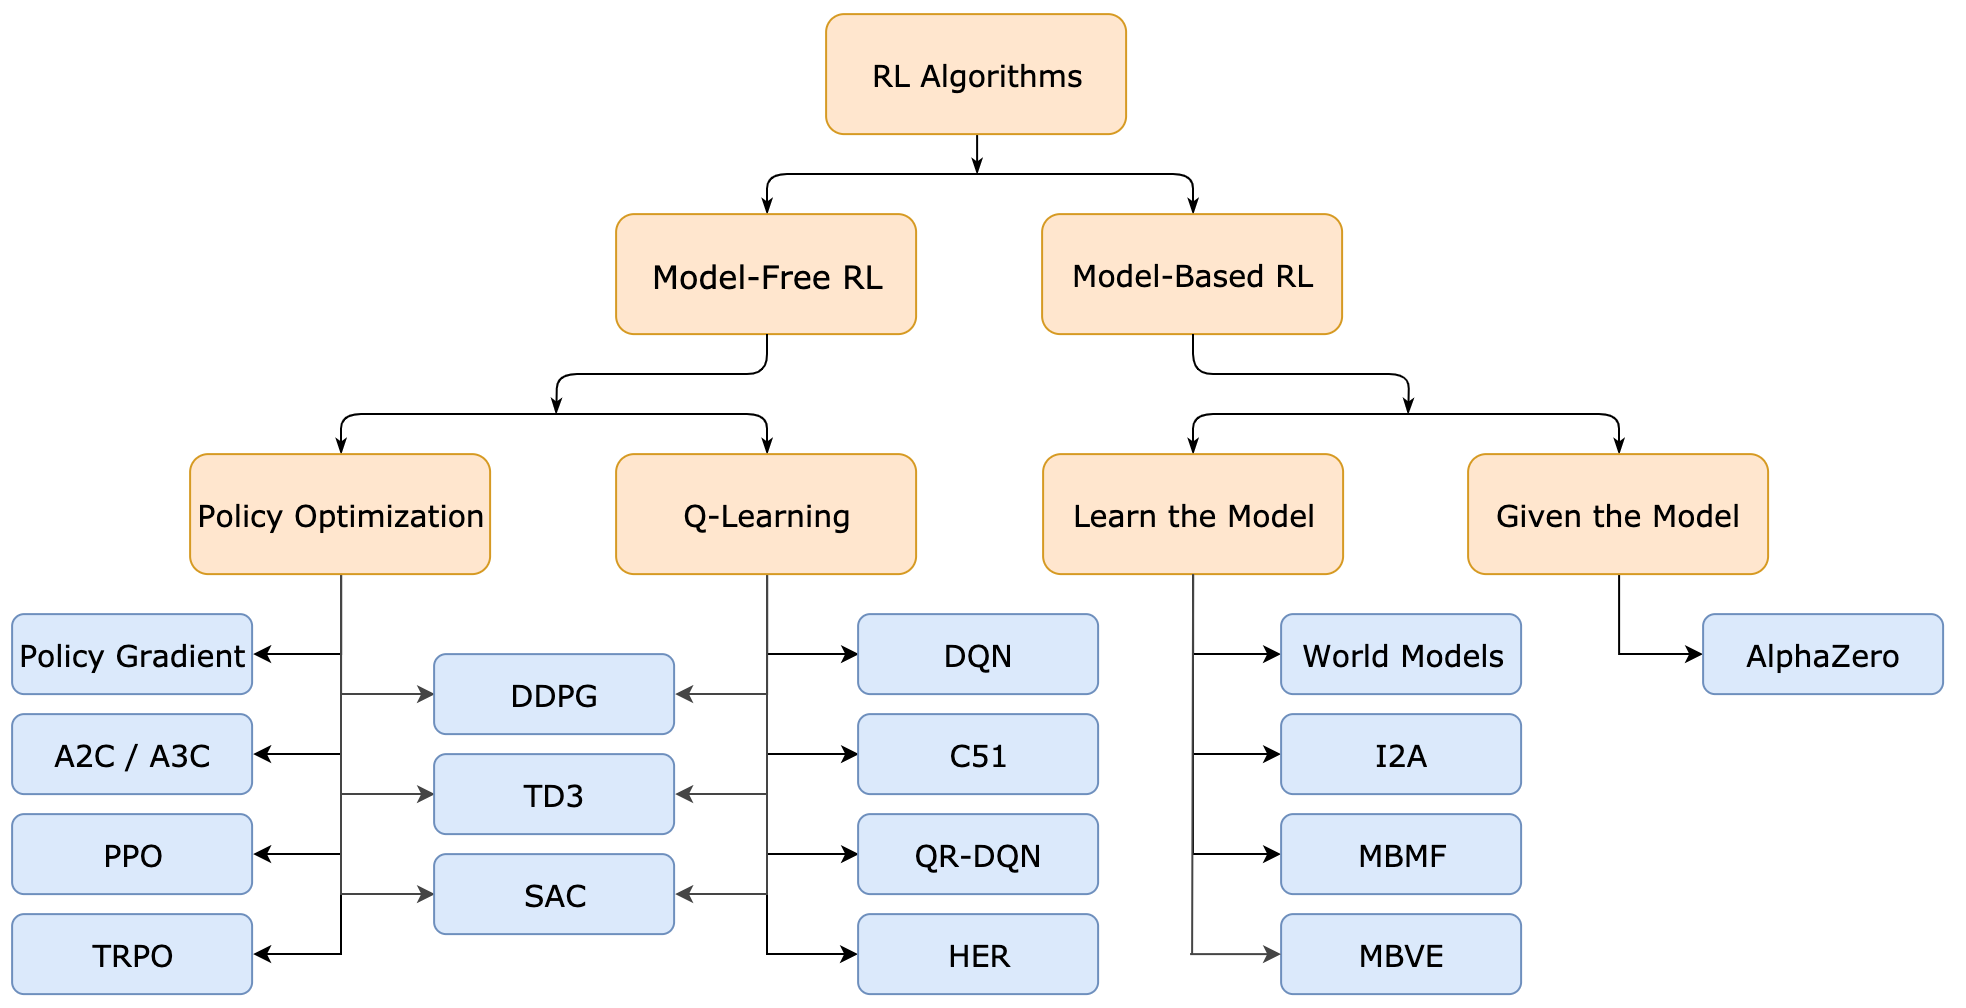
Reinforcement Learning
SQL
window functions, row_number() and partition(): tutorial
COALESCE(): evaluates the arguments in order and returns the current value of the first expression that initially doesn’t evaluate to NULL. tutorial
Geometric: used in finance to calculate average growth rates and is referred to as the compounded annual growth rate. wolfram
Harmonic: used in finance to average multiples like the price-earnings ratio because it gives equal weight to each data point. Using a weighted arithmetic mean to average these ratios would give greater weight to high data points than low data points because price-earnings ratios aren't price-normalized while the earnings are equalized. wolfram
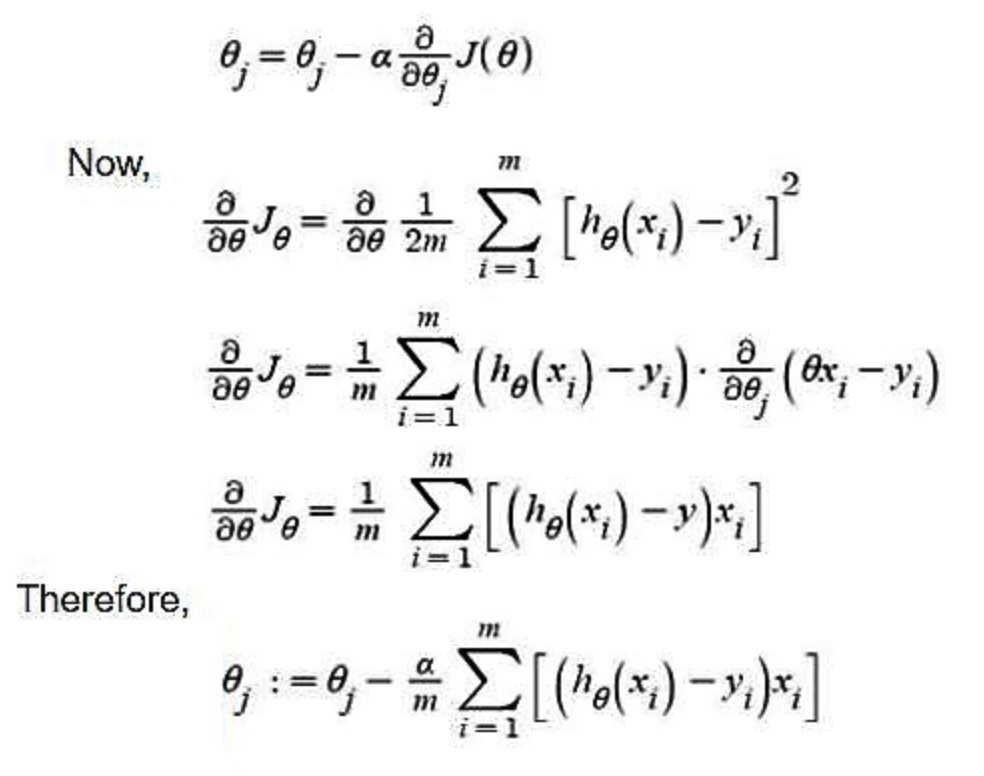
Sample variance: divided by n-1 to achieve an unbiased estimator because 1 degree of freedom is used to estimate b0. tutorial
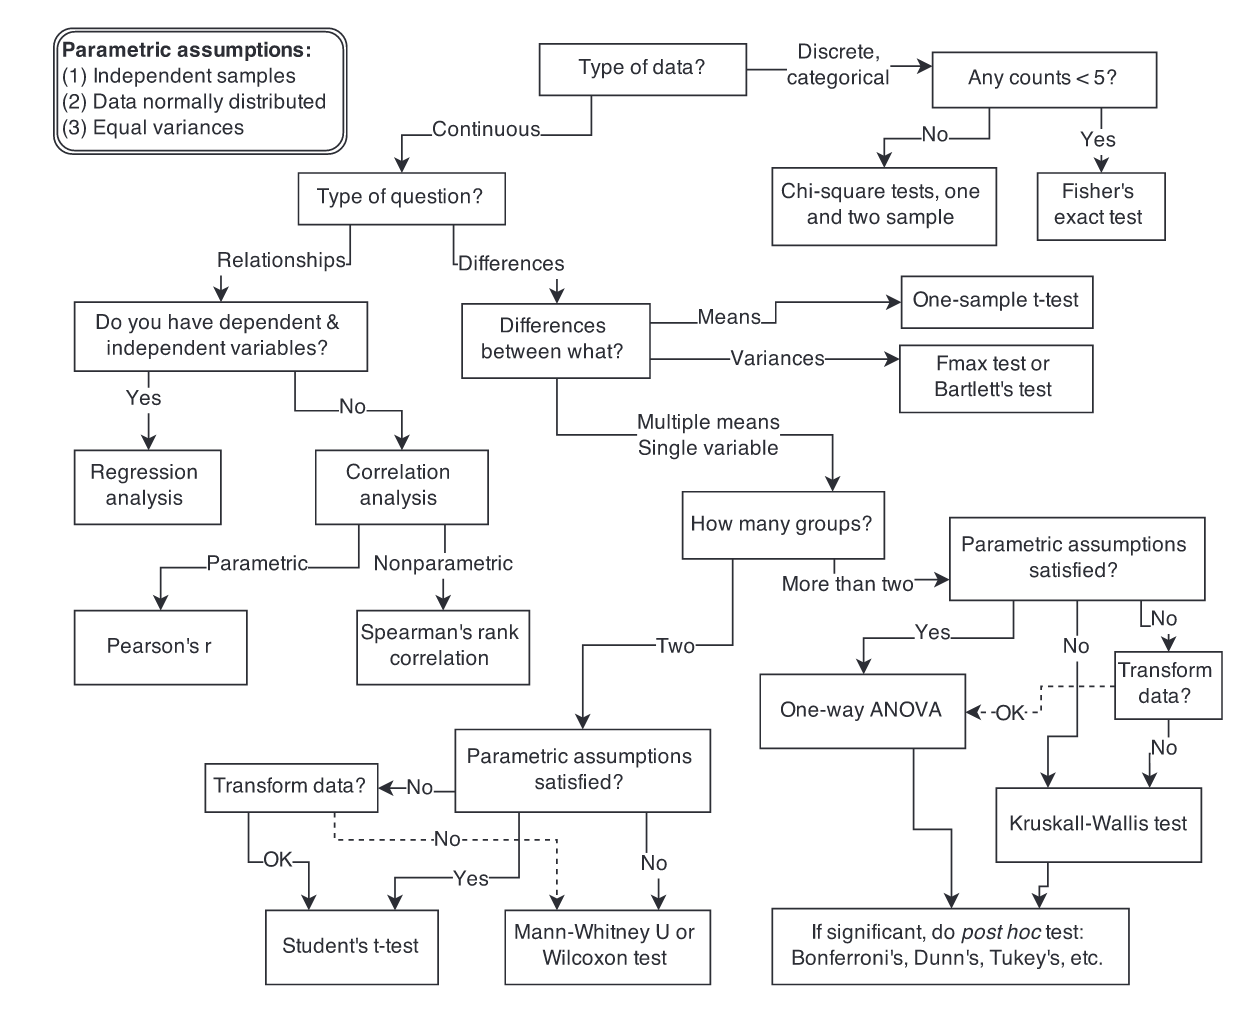
Tests
ANOVA: Analysis of variance compares the means of three or more independent groups to determine if there is a statistically significant difference between the corresponding population means. Statology tutorial
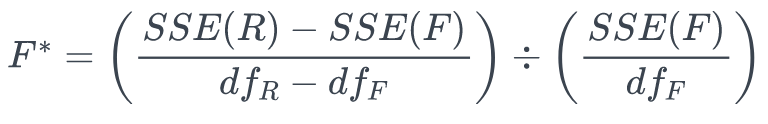
F-statistic: determines whether to reject a full model (F) in favor of a reduced (R) model. Reject full model if F is large — or equivalently if its associated p-value is small. tutorial
 scikit