Keras LSTM Forecasting Using Synthetic Data
Contents
Summary
Keras LSTM can be a powerful tool for forecasting. Below is a simple template notebook showing how to setup a data science forecasting experiment.
Dataset
A synthetic dataset was generated using a scikit-learn regression generator make_friedman1. The dataset is nonlinear, with noise, and some features are manually scaled to make the deep learning task more challenging. Time series dependence is created by making each label a weighted average of the make_friedman1 generated values and previous labels. For details see notebook function generate_data().
The image below shows correlations between the generated features and future_label we are trying to forecast. Features x_0 - x_4 are the only informative features as can be verified from the bottom row showing meaningful but not very strong correlations:

Model training
The model is a simple NN with a single hidden layer defined as
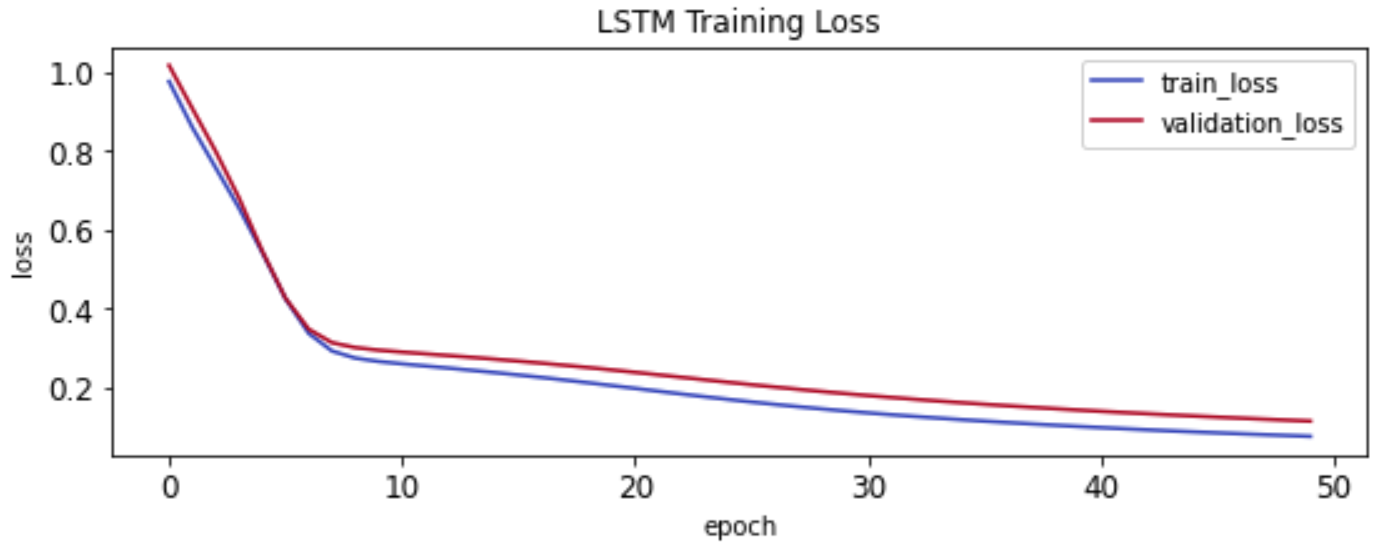
keras.layers.LSTM(32). The generated dataset is split into training, validation, and test sets, each honoring time series nature of the data. Validation set is used to stop training early to prevent overfitting. However, this is not a concern for our synthetic dataset as can be seen from following chart. The validation curve never starts increasing as training epochs continue:
Model evalution
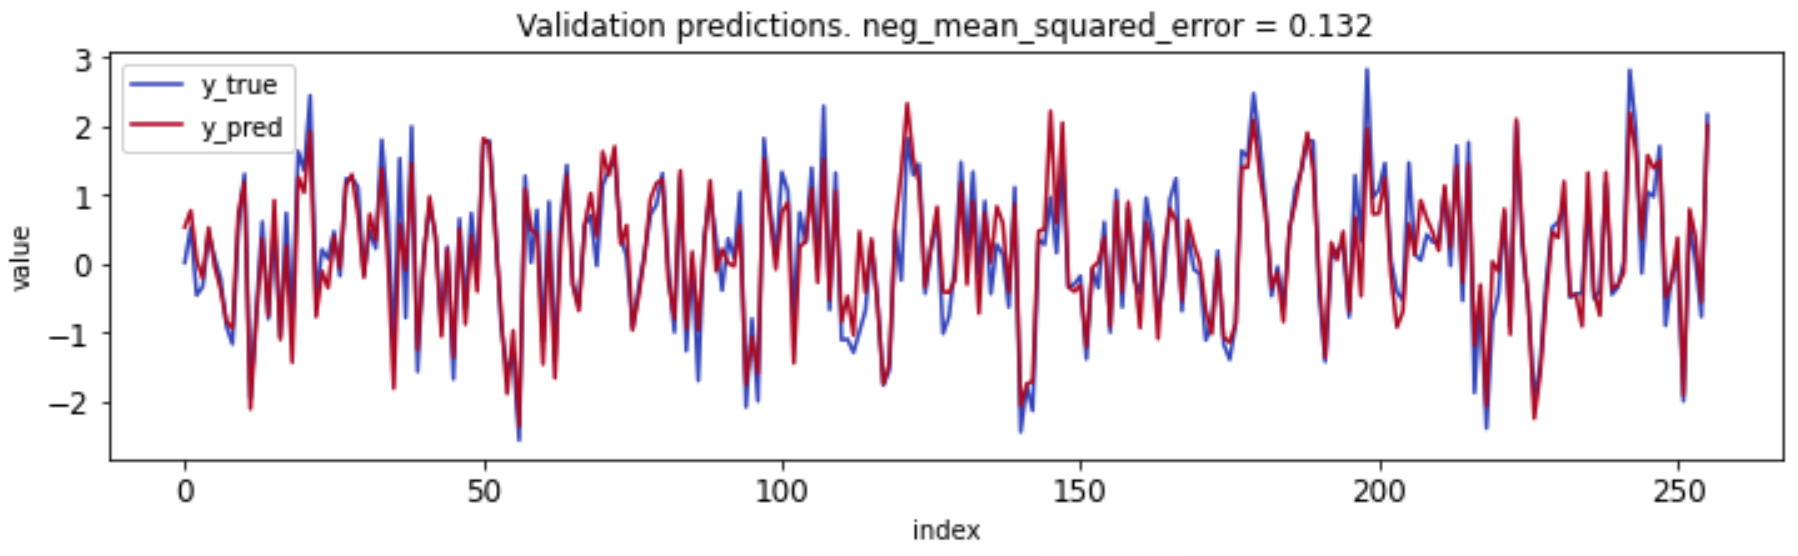
Comparing predictions and actual labels for the validation set shows strong performance even though there are clear optimizations that can be made near extreme values:
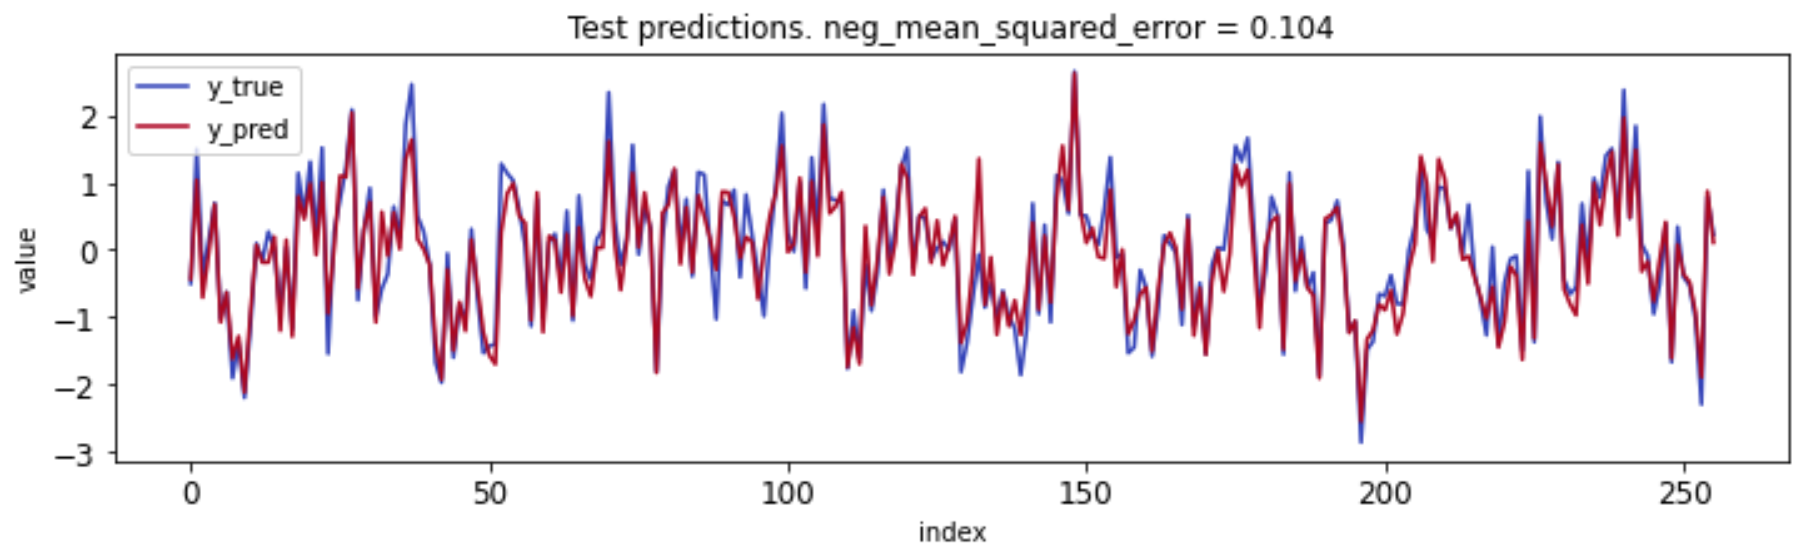
However, the validation set was already used during training for early stopping. This is why we set aside a test dataset the model has never seen during training. The test dataset is the only true evaluation of the expected performance of the model and in this case it confirms that the model performs well for the synthetic dataset:
Notebook